Lighthouse Scores and Ecommerce: What Your Team Needs to Know
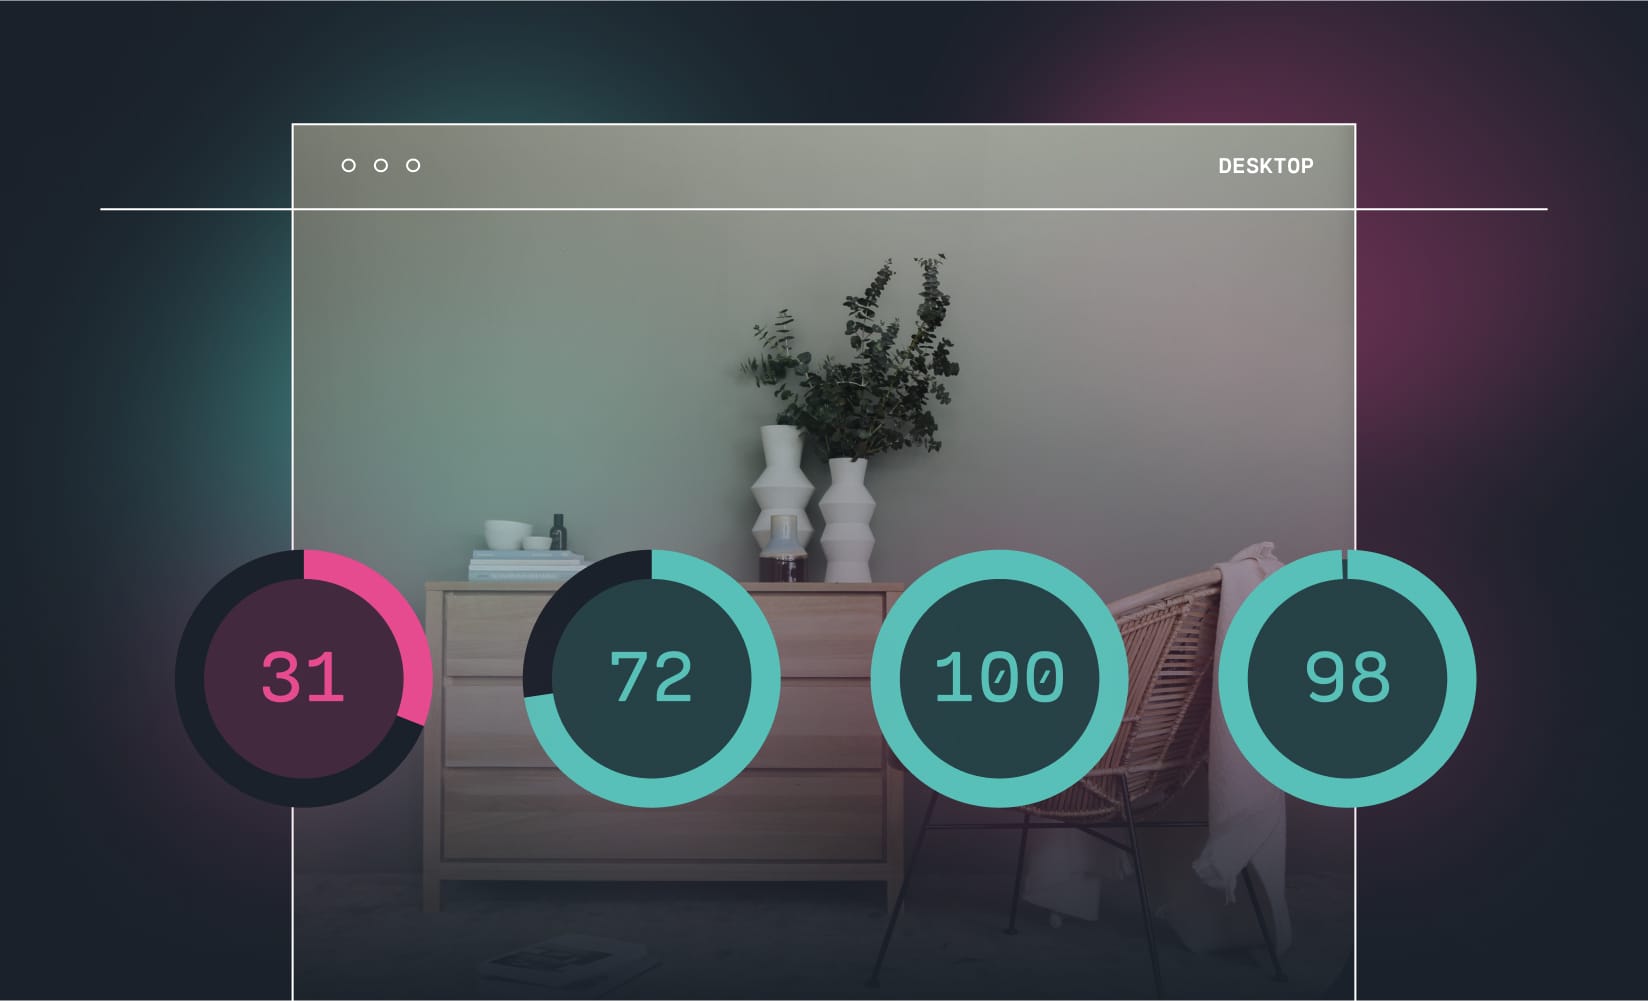
There’s no question your owned website channel is critical to your ecommerce business. And, so is its performance: how efficiently your online store runs and serves up to customers.
Of course, your storefront needs to look exceptional. But it also needs to be fast-loading to convert visitors.
As your team iterates on your site experience, you need to know how speed and performance is impacted by any changes.
Enter: Google Lighthouse.
While there are many ways to diagnose the health of your ecommerce site, Google Lighthouse is an effective tool to understand how your site stacks up. The tool will tell you how Google perceives your site’s usefulness to visitors—and how the search giant may reward or punish your store in the SERP as a result!
However,there are a lot of misconceptions around what Lighthouse scores tell you exactly.
As an ecommerce manager, you don’t have time to parse through what is and isn’t true about Lighthouse scores, so we’ve done the homework for you.
Today, we’ll dive into what these scores mean (and what they don’t), plus how to make sense of your score, and a few practical ways to improve it.
Settle in, and let’s get down to business.
Skip ahead:
- What is a Google Lighthouse score?
- How is your score calculated?
- How important are Google Lighthouse scores?
- How should you interpret your score?
- The potential downsides to Google Lighthouse
- How to run a Google Lighthouse audit
- How to improve your scores
A Google Lighthouse score is the rating Google gives your site based on a combination of performance, accessibility, SEO, and best practice criteria in artificial conditions that mimic real ones.

In other words,Lighthouse shares a rating of your site based on an environment that imitates how real customers will experience your store. It’s a simulation allowing you to learn how a potential customer will find your store’s performance.
Lighthouse uses lab data—or data based on an artificial page load of a real-world user with fixed network conditions—to calculate the scores. This type of data is ideal for debugging performance issues like site speed or too-big CSS files.
Lighthouse considers the following criteria—each with varying weight:
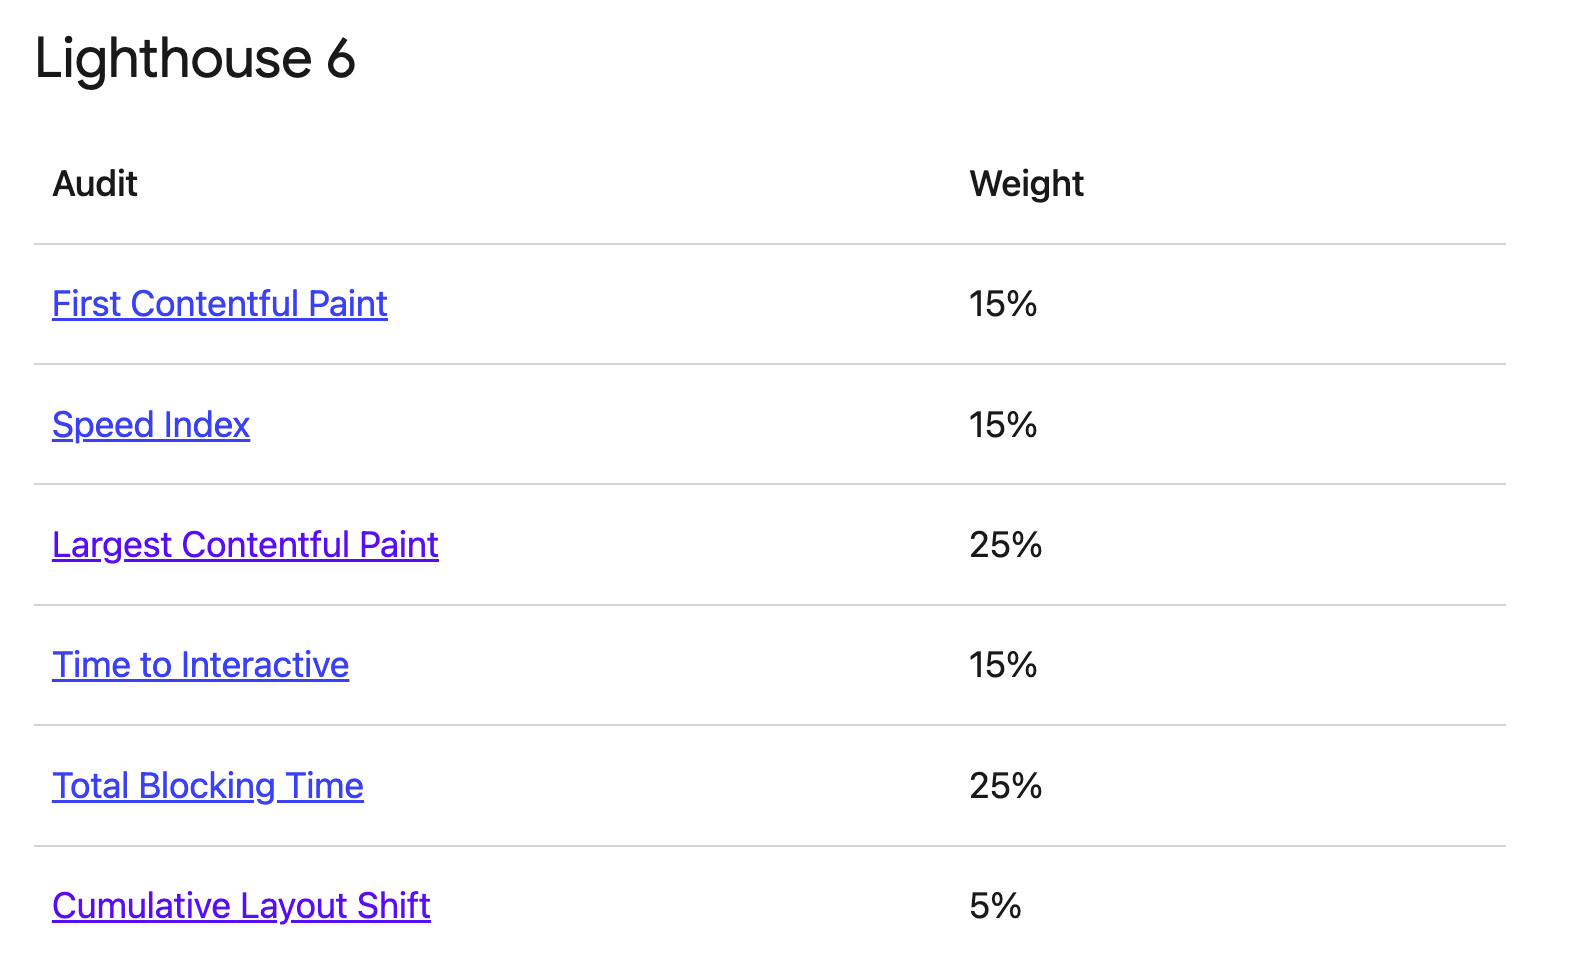
Google converts each raw metric value into a metric score from 0 to 100 by looking where the metric value falls on its Lighthouse scoring distribution.
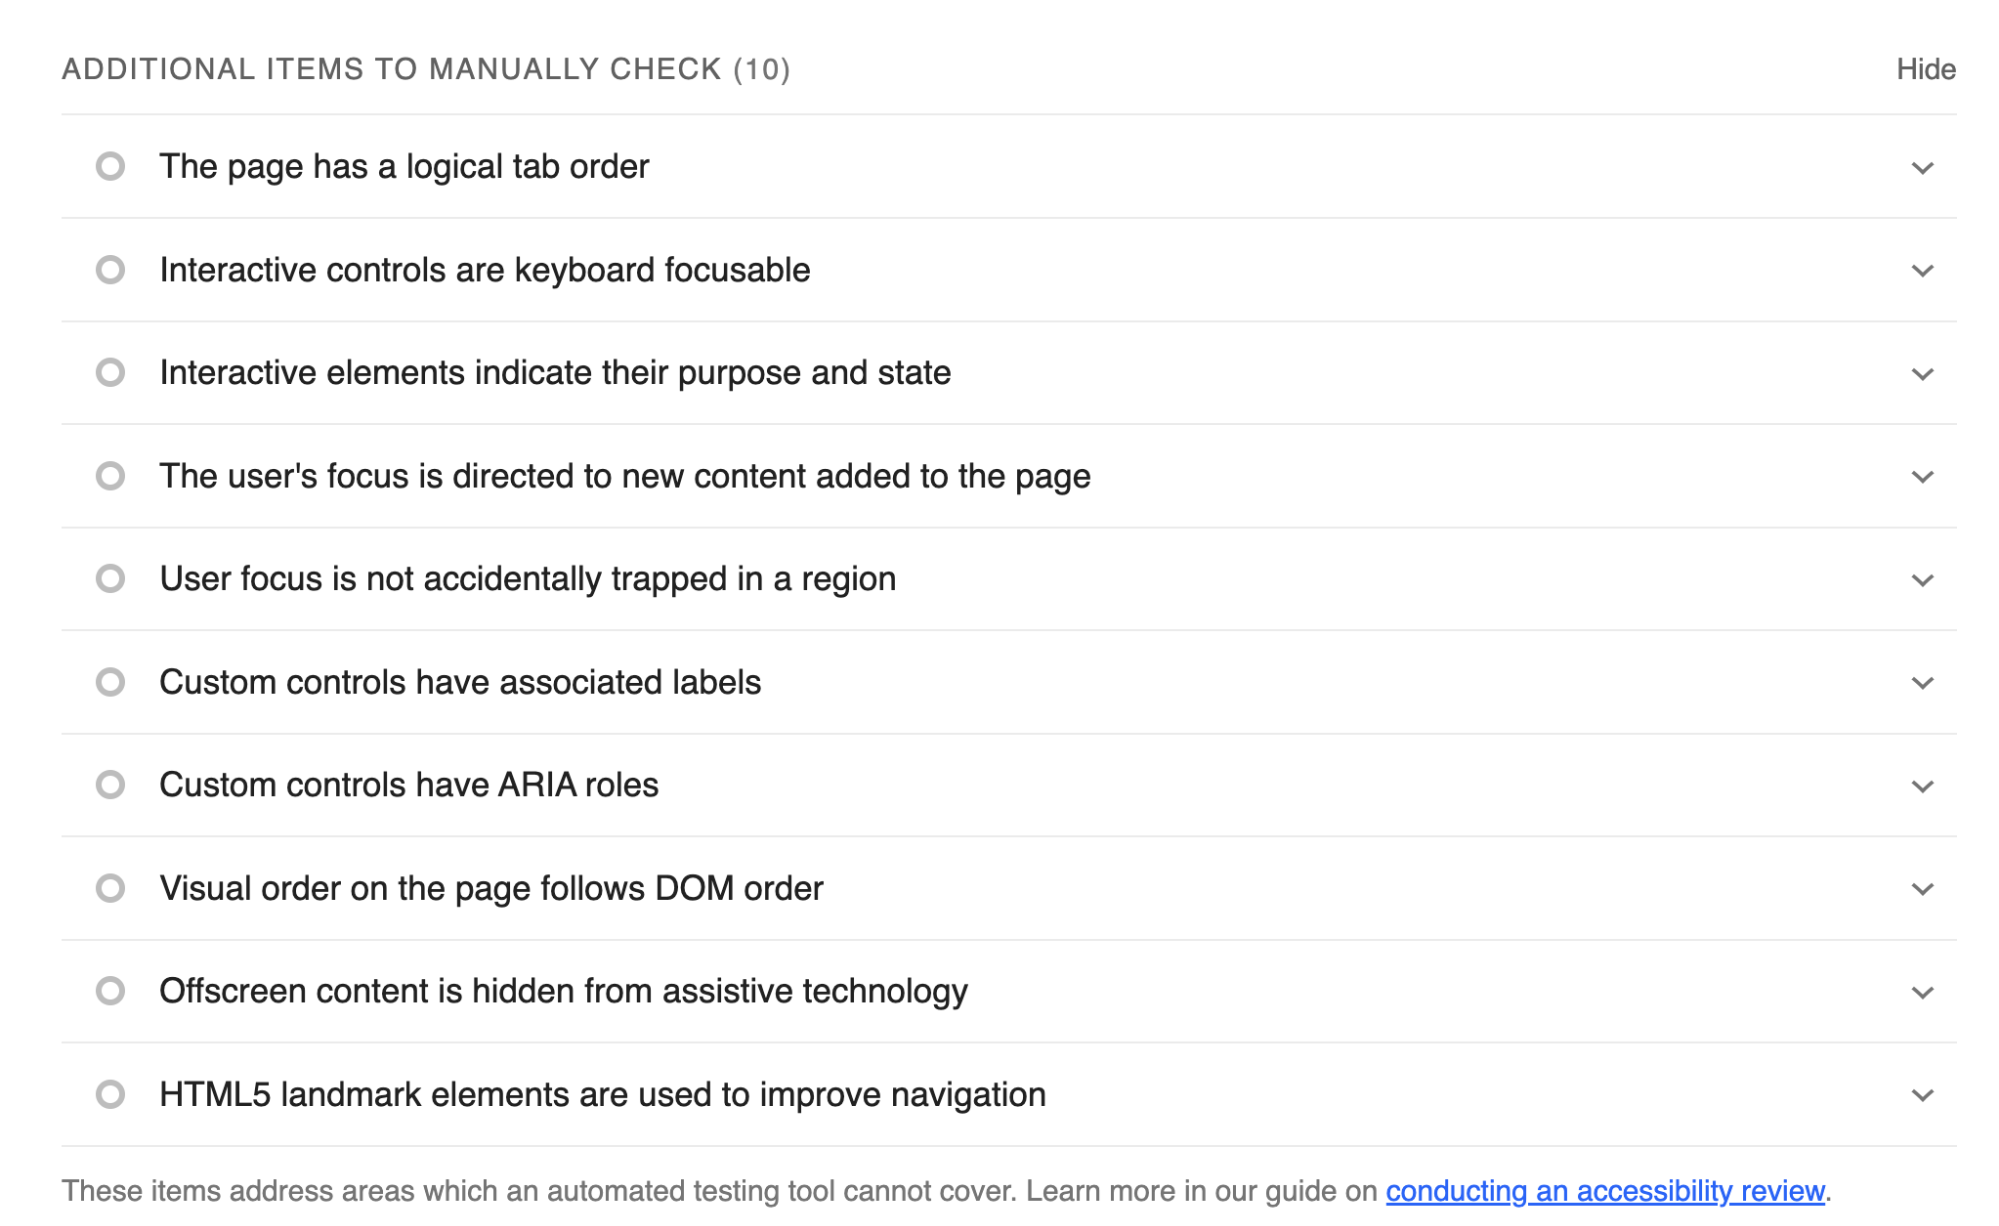
Each category in your resulting report includes info like which audits your site passed or failed, along with areas you should check manually that can’t be tested with Lighthouse—like your pages having logical tab order and other accessibility variables.
It’s important to note that each metric plays a part in measuring your comprehensive score; that is—no one metric is more important than another (like speed index vs. total blocking time) despite how things are weighed.
How are Google Lighthouse scores different from Core Web Vitals?
Put simply, Google Lighthouse scores are one way to measure how your site stacks up against Google’s Core Web Vitals—or the set of site performance metrics Google deems the most important when evaluating web experiences. Other tools similar to Lighthouse for this same purpose include Page Speed Insights and Web Dev Tools.
As a handy way to think about it:
- Google Lighthouse is a measurement tool.
- A Lighthouse score is your rating (a “good” score is between 90 – 100—more on that later!).
- And Core Web Vitals are the measurement criteria.
In 2020, Google announced that Core Web Vitals would be the standard for how sites are ranked in search:
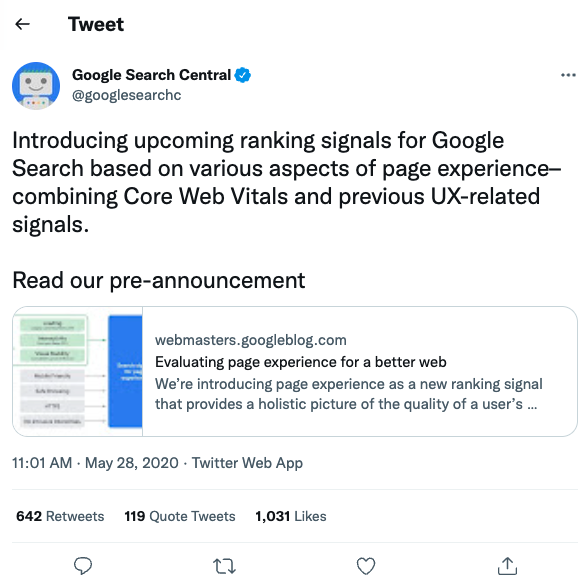
Basically, Google directly indicated which metrics/criteria ecommerce web teams should pay closest attention to with this grading scale, and, better yet, what you can do to improve your score.
The following three metrics make up the “core” in Core Web Vitals (and are where you can focus your energy for results!):

- Largest Contentful Paint (LCP): This metric marks the point in the page load process when the page’s main content has loaded. Google recommends your LCP happening within 2.5 seconds or less of when your site first starts to load.
- First Input Delay (FID): FID measures load responsiveness. It measures the time from when a user first interacts with a page (like when they click a link) to the time when the browser begins to load what happens after (in this case, what happens after a customer clicks the link). It’s tough to keep shoppers on your site if it takes several seconds for your site to respond after an action. It’s recommended to aim for an FID score of 100 milliseconds or less.
- Cumulative Layout Shift (CLS): You know when you’re on a site and the page layout jumps a little, causing you to accidentally click on something you didn’t intend on clicking? CLS measures that—or anytime a visible page element changes its position. Google updated their gauge of CLSin 2021, and now recommends a max session window with a one second gap that’s capped at five seconds.
Brands have been using Core Web Vitals as the barometer for how to outperform competitors online. And the brands who don’t stay highly performant are penalized (with poor search rankings and higher ad costs).
#cta-visual-fe#<cta-title>An ecommerce storefront built for performance<cta-title>Learn how you can leverage a highly performant frontend layer (built with progressive web app technology!) to improve your Lighthouse score and conversions. Learn more
Tools like Google Lighthouse help you understand not only how customers experience your ecommerce site but also how to make the experience better. They help you steer the ship.
A low score suggests your shoppers are getting a poor experience because it’s slow to load, doesn’t meet accessibility standards, and is difficult to discover because it’s not optimized for search—or delivers poor page-to-page experience.
There are several reasons why ecommerce web teams look to tools like Google Lighthouse, including:
- Understanding the overall health of your site at any point in time: You can run a Lighthouse audit at any time and see how your store is performing at that moment. This is helpful to see in real time.
- Monitoring the performance of your site as you make changes: Your site is evolving and growing. Lighthouse helps you make sense of what’s resonating and what needs to be optimized, especially as you make design changes that may impact performance.
- Identifying big issues that could affect your bottom line: These audits can help you uncover problems blocking customers from purchasing—like if a page is too slow to load (ever!) or has wonky formatting preventing the user experience entirely. Each second of load time can negatively impact conversions.
#cta-paragraph-fe#💡Google Lighthouse is just one tool to measure how your site is performing at a moment in time. It’s recommended to use it as a gauge, not a red-inked grade.
Your Lighthouse score is a weighted average of several performance metrics based on how your site appears to visitors.
Your performance score will be between 0 and 100, with higher scores being better.
Scores are color-coded:
- 0 – 49 (red): Poor
- 50 – 89 (orange): Needs improvement
- 90 – 100 (green): Good
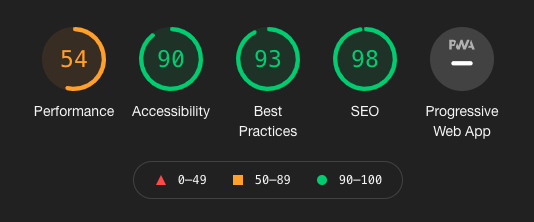
If your audit scores any “needs improvement” or “poor” ratings, you can take steps to improve those areas of your site per the audit suggestions.
Because Core Web Vitals are such a straightforward way to understand how your site is being analyzed, it’s no surprise brands look to the measurement tools—like Google Lighthouse—as gospel.
But the truth is, tools light Lighthouse are not a definitive indicator of performance.
Here’s why: A strong user experience cannot be captured by a single point in time. Rather, it’s made up of several touchpoints—marked by what Core Web Vitals measures—and should be tested repeatedly.
How one ecommerce visitor experiences your site may not be the case for another depending on several factors, like internet connection, browser version, device, etc.
Globally-placed content delivery networks (CDNs) help with how fast customers experience your site, but with so many variables in the mix brands can’t control (like a shopper’s internet connection),it’s simply not possible to gauge the experience everyone’s having from a single Google Lighthouse audit.
While it’s tempting to view your Lighthouse score as your True North marker, there are many potential pitfalls in doing so:
- Lighthouse scores are a measure for a controlled, pre-defined test environment
- It’s a measurement based on certain metrics and doesn’t consider other factors that impact site speed (like internet connection, proximity to a CDN, device, etc.), which can be an issue for brands
- It’s easy to gamify results using the latest and greatest computers and chips (since these scores are largely dependent on test infrastructure), and
- There’s a fair knowledge gap in how scores are calculated and why they change
Ultimately, Google Lighthouse is a powerful tool for diagnostics, but it’s important to understand how it’s meant to be used; namely it’s a way to frequently test and check the performance of your site as it evolves.
Google recommends you use your score as a general barometer and check in on your averages over time.
#cta-visual-fe#<cta-title>An ecommerce storefront built for growth<cta-title>Learn how you can leverage progressive web app technology to improve your Google Lighthouse scores. Learn more
For when you’re ready to go check your site’s performance, there are two ways to find your Google Lighthouse score:
- Google Lighthouse Chrome extension
- (and alternatively) the DevTools Audits panel
#cta-paragraph-fe#While both methods are helpful, the DevTools Audits panel way allows you to see IRL how your score fluctuates as customers explore your site.
Let’s look at both ways:
How to run an audit with the Google Lighthouse Chrome extension
Using the Chrome extension is an easy way to see your score.
Start by installing the Chrome extension, found in the Chrome Web Store. Then, in a new browser window, navigate to your site:
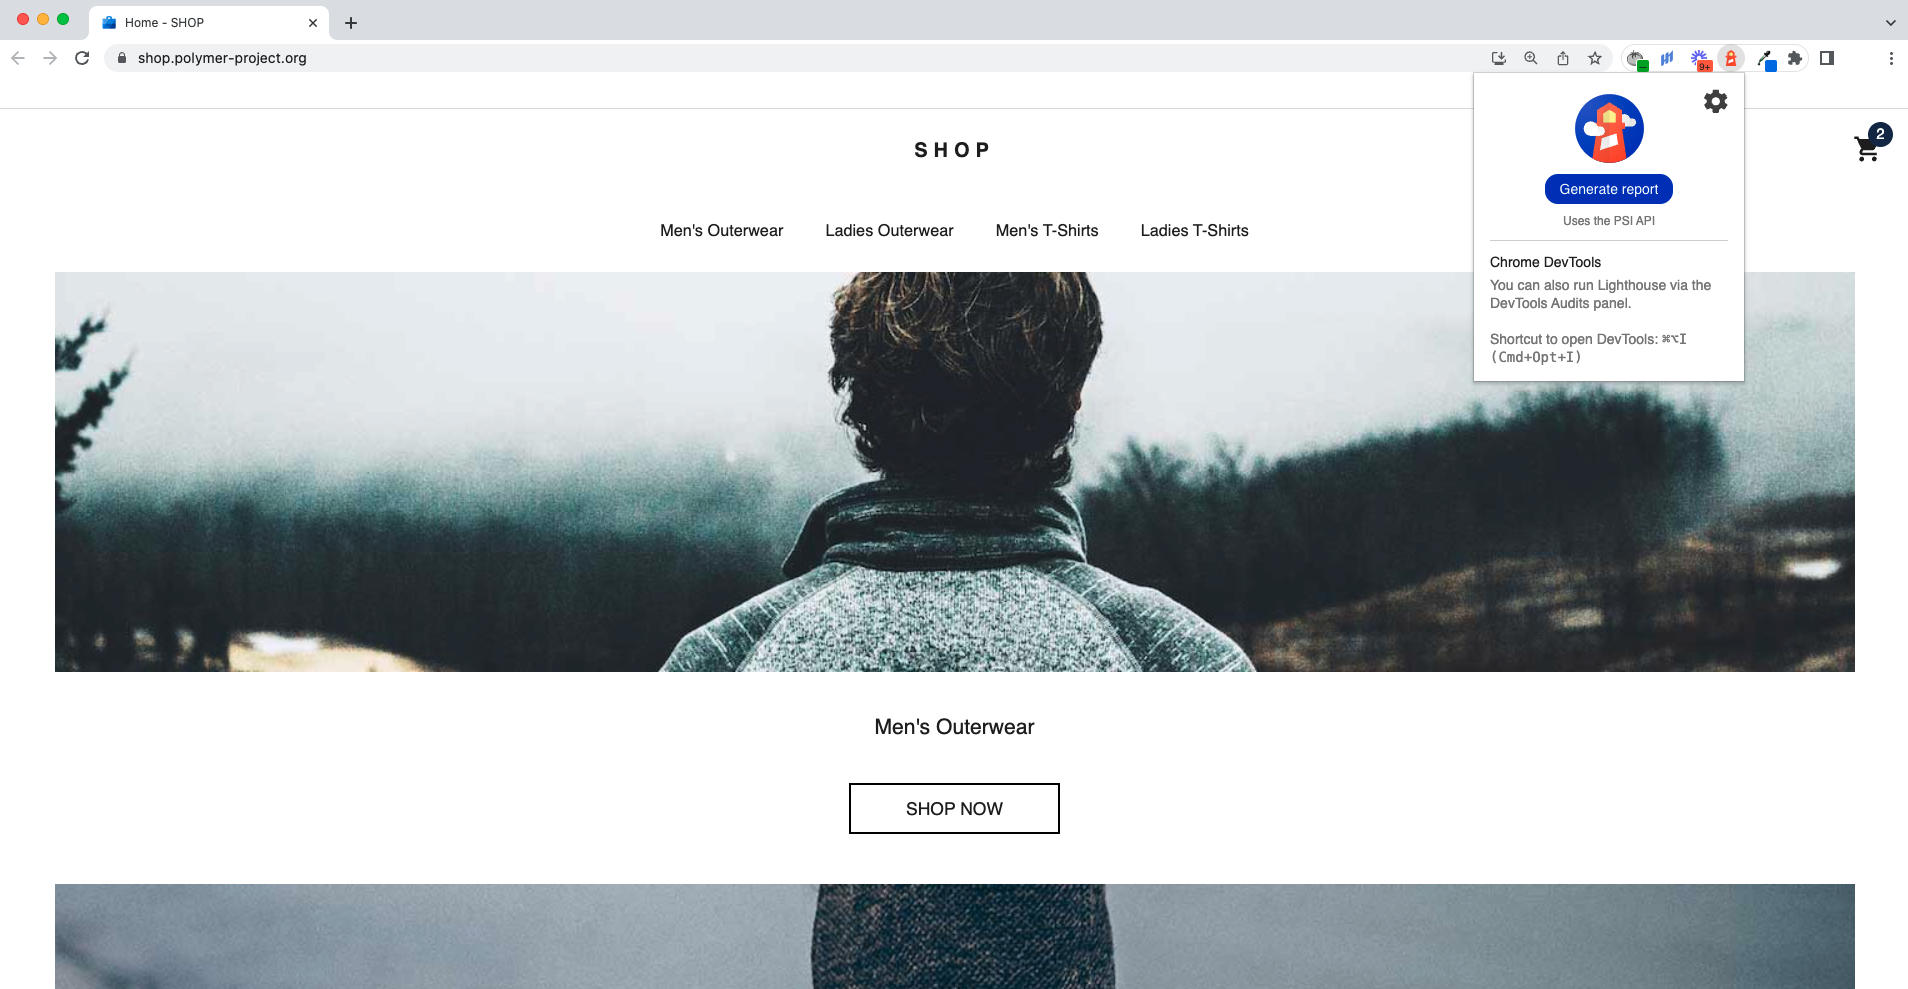
Next, click on the Google Lighthouse icon in your extensions bar, then click “Generate Report.” Your audit will begin; it might take a few seconds to load.
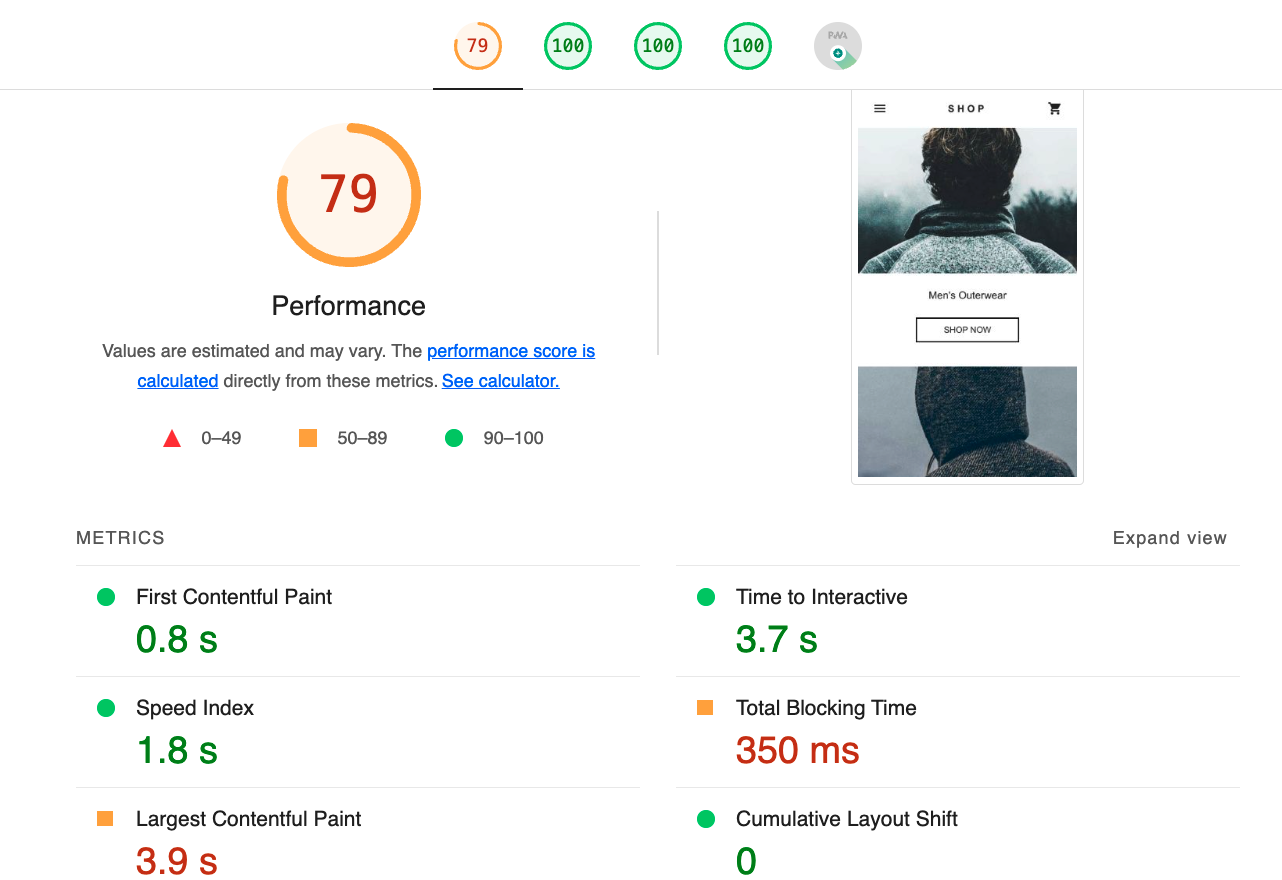
You’ll see how your site scores overall in each category with individual breakdowns as you toggle between categories.
How to run a Google Lighthouse audit with the DevTools Audits panel
Similar to the Chrome extension, start by loading your site. Then, there are two ways to access the DevTools Audits panel:
- Option + Command + i
- > More Tools > Developer Tools
Both ways will get you to this window:
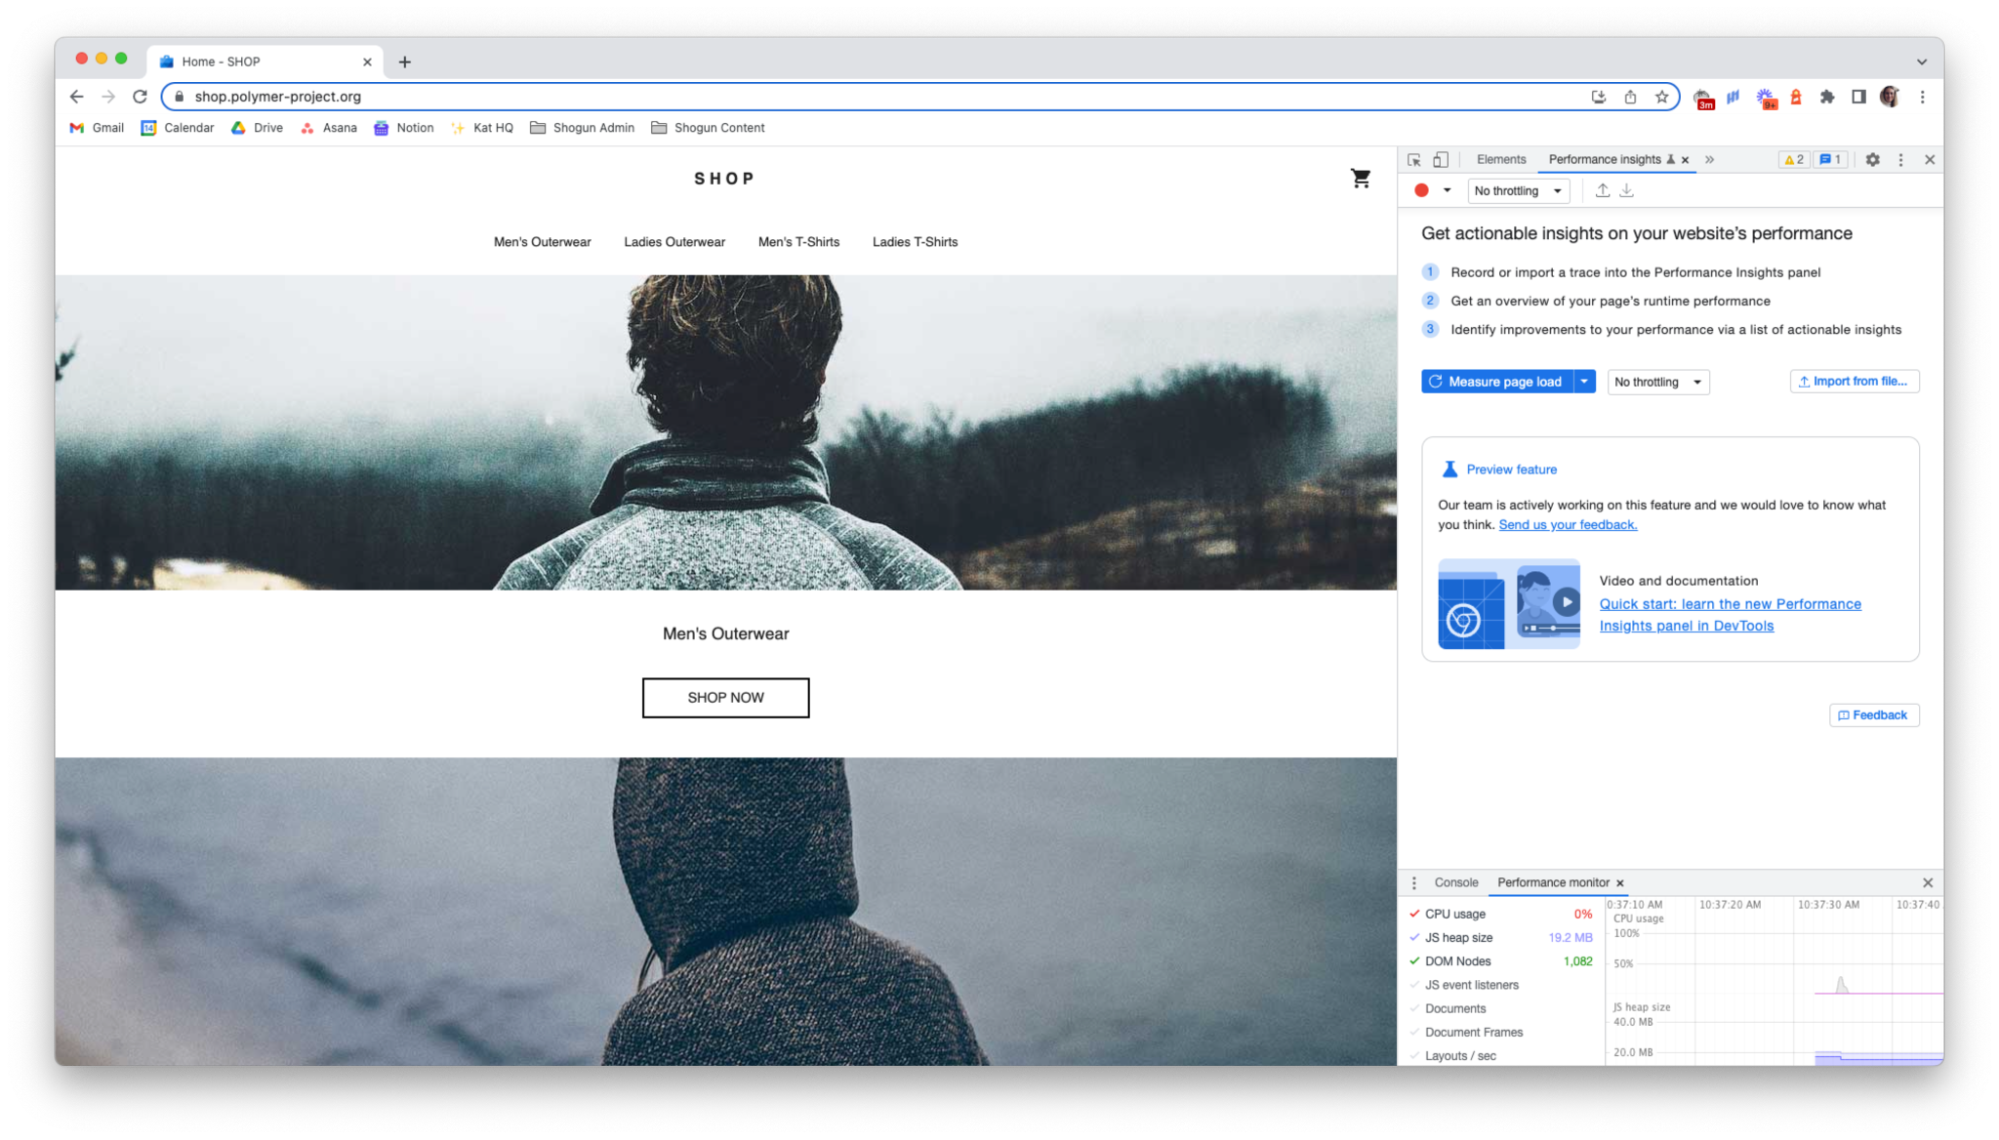
From here, click “Measure page load” and Google Lighthouse will begin running the audit.
After your audit loads, you’ll see your results but in a different format from the Chrome extension version:
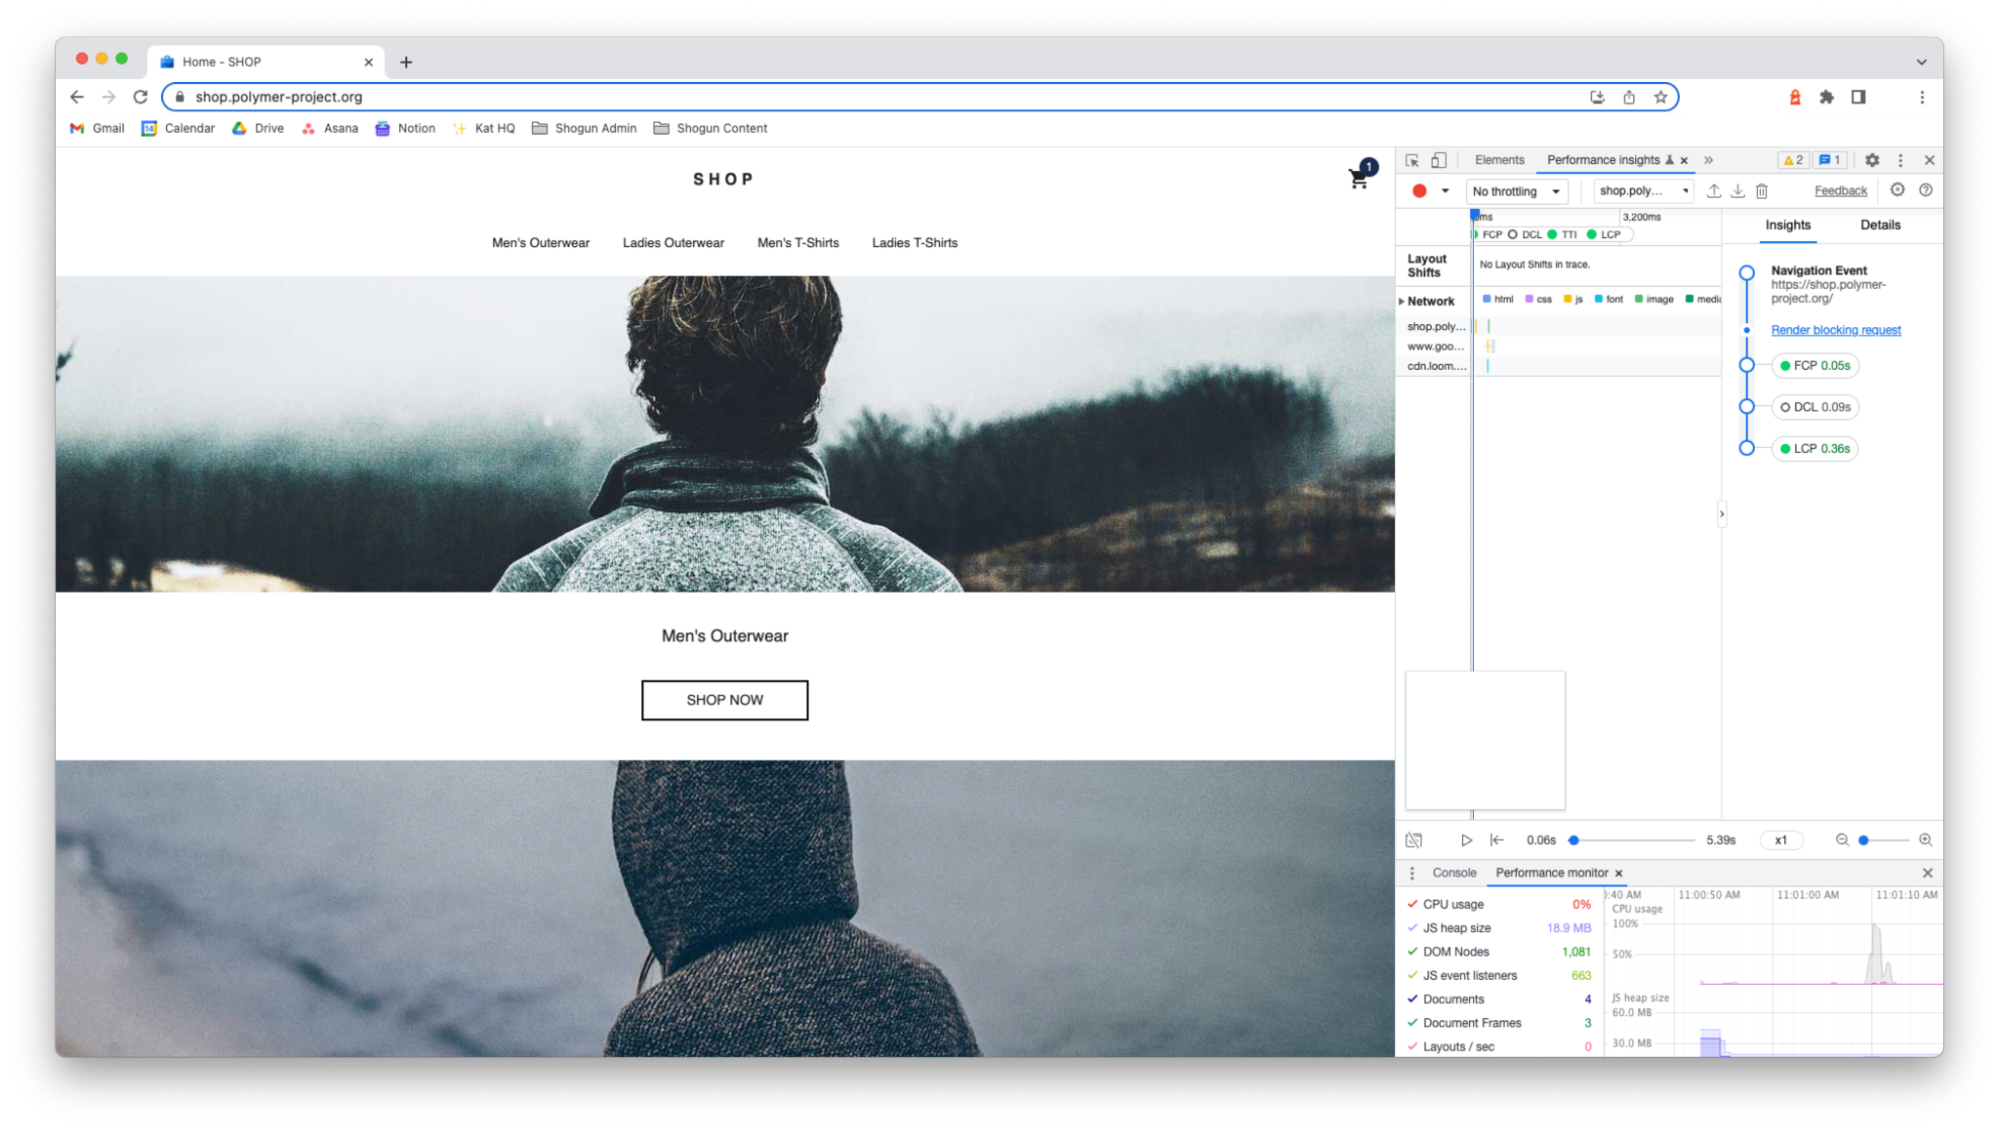
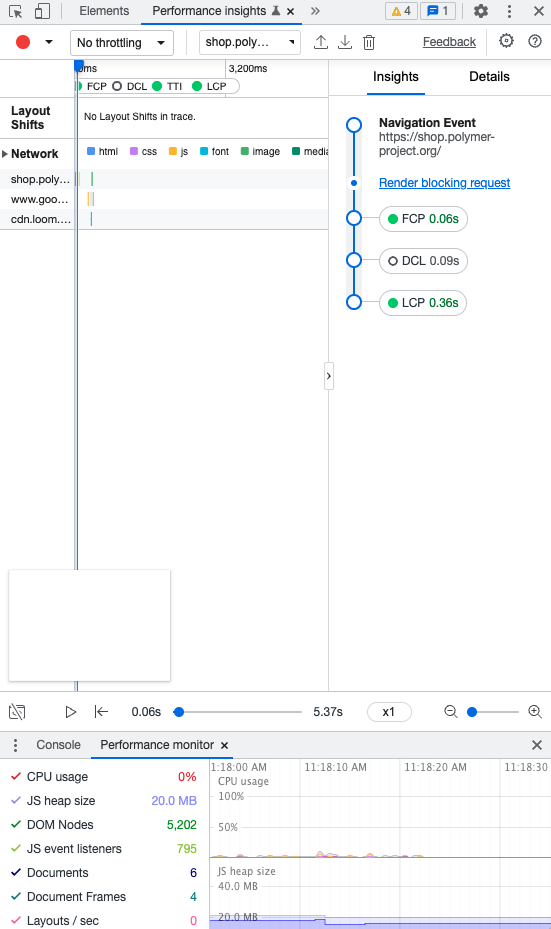
This method shows metrics like First Contentful Paint (FCP), DOM Content Loaded (DCL), and Largest Contentful Paint (LCP). What’s unique about this version of the audit is that you can see how your site performs as you navigate through it in real time—much like a customer would.
Why is my Google Lighthouse score different every time I test it?
Just like how uncontrollable variables of the customer experience impact your Google Lighthouse score, as you make changes to your site (like compressing image sizes or adding third-party apps), your score is bound to change with it.
Take this audit of Nordstrom.com, for example:
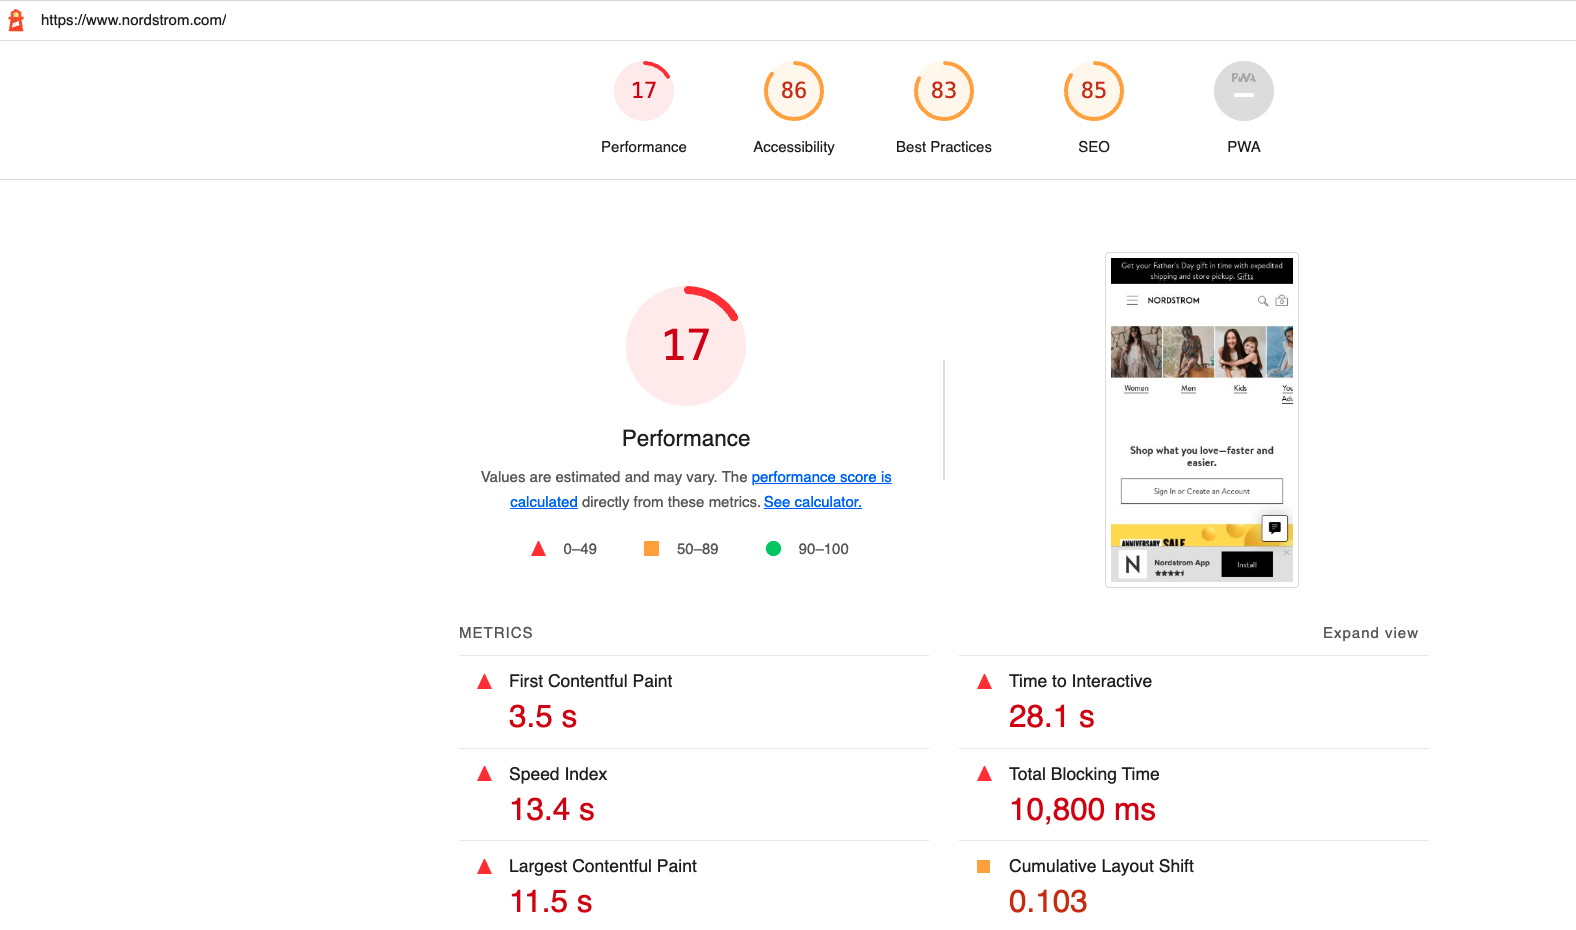
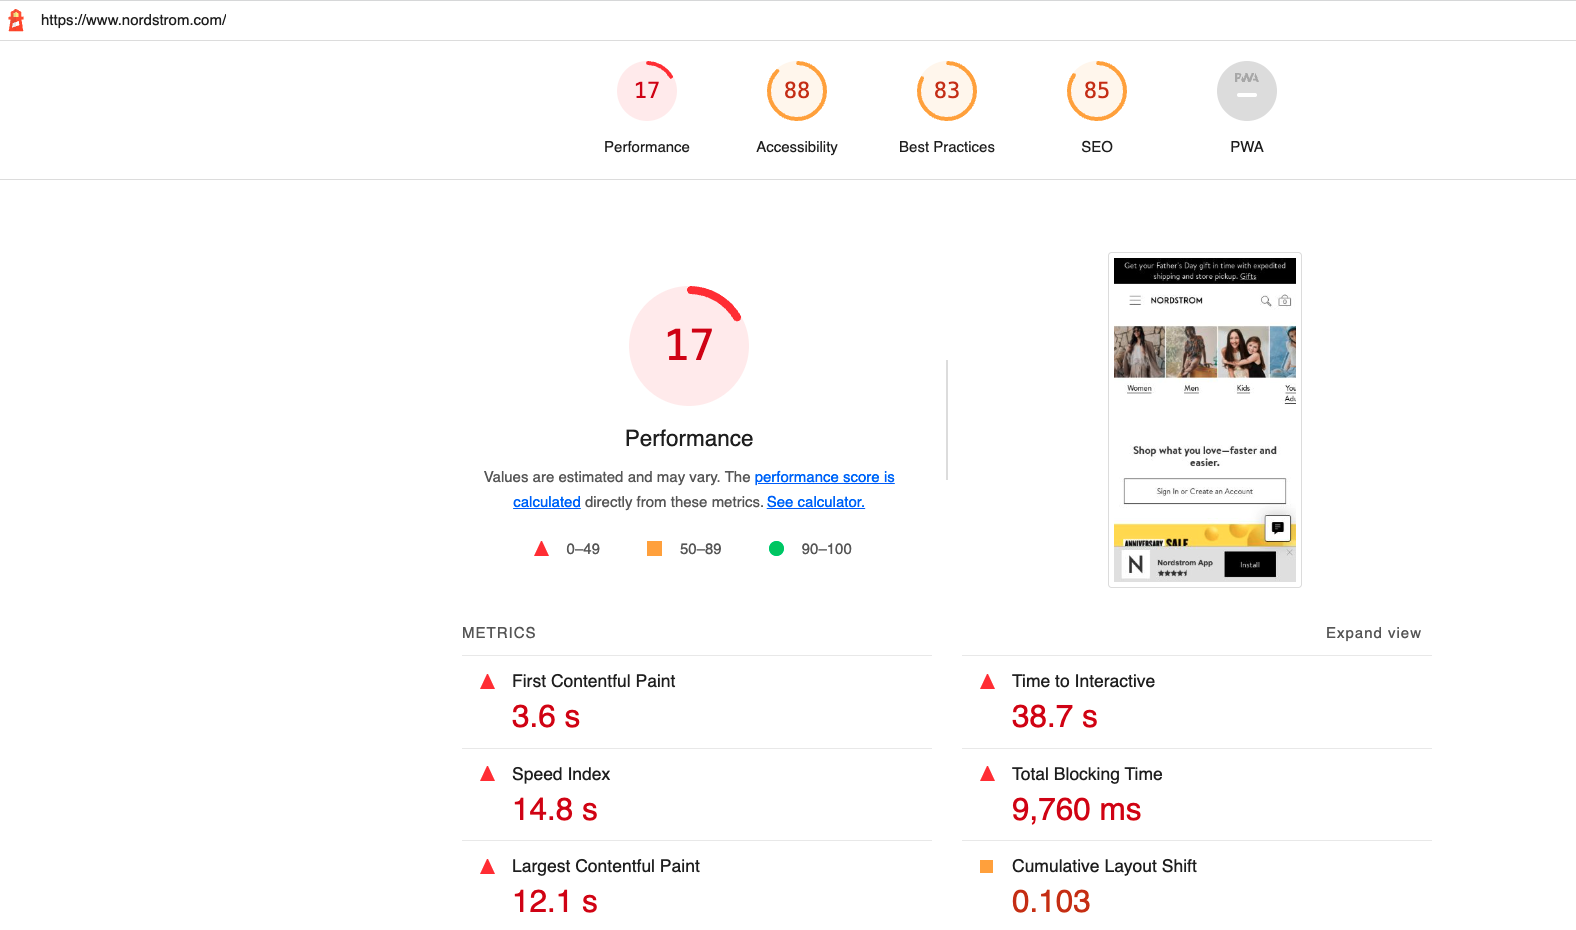
These audits were run consecutively and vary ever so slightly. At the same time, your score can change even without direct changes to your site.
Google Lighthouse notes sources of variability with these scores—like local network variability (how strong your internet connection is) and client hardware variability (make and model of the device you’re using).
Plus, some of the “high impact” variables are unlikely to happen within lab data measurement but likely experienced by real-world customers. In other words, your score will change yet it might not show what real shoppers experience.
#cta-paragraph-fe#🧭 It may be helpful to think of Google Lighthouse scores like a compass: Your score tells you where you’re headed (where your site could improve) but if you start to go a different direction, the compass direction will change (if you’re constantly making changes to your site, your score will change, too).
If your average Lighthouse score isn’t quite where you’d hoped after repeated testing, don’t worry. There’s lots you can do to improve your scores.
Let’s look at five needle-moving optimizations you can try today.
1. Optimize your site visuals (beyond compressing them)
You’ve likely familiar with the importance of optimizing visuals throughout your site, but this best practice is always worth repeating because it’s so impactful.
Plus, the numbers don’t lie: responsive images are linked to a higher percentage of 100/100 Lighthouse speed scores:
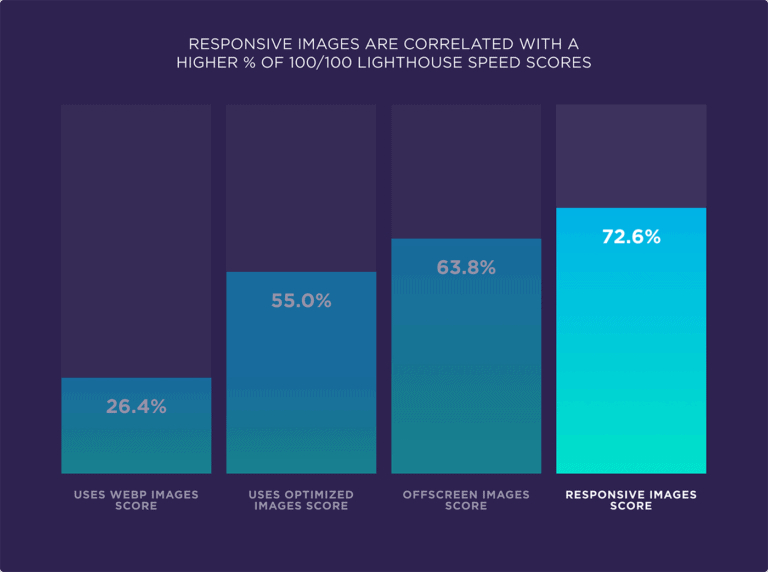
There’s a delicate balance when considering the format, dimensions, and resolution of images on your ecommerce site. You want to ensure you’re serving up the smallest file size possible without sacrificing image quality.
The fix? Use media optimization services, like Cloudinary, that provide advanced image and video optimization capabilities.
2. Add a preconnect for faster load times
Your site is juggling a lot of things as shoppers explore. When establishing server connections, many steps are required, like DNS lookups, redirects, etc. These steps, while vital, can make your site seem sluggish.
You can speed up this process by adding a preconnect () to establish early connections to critical third-party origins. In other words, with preconnects, this tells your browser that your store intends to connect with another origin, so that process can begin ASAP.
3. Reduce JavaScript bundle sizes
A surefire way to improve your site performance (and Google Lighthouse scores) is to reduce your JavaScript bundle size.
The lower the JavaScript bundle size, the faster your store.
One way to do this is by code splitting—or separating your code into smaller bundles and loading them on demand. This can have a significant impact on load time because it reduces the number of page requests.
#cta-visual-fe#<cta-title>An ecommerce storefront built for growth<cta-title>Learn how you can leverage progressive web app technology to improve your Google Lighthouse scores. Learn more
4. Include only critical CSS files on your site (lazy loading)
To show a page to a site visitor, browsers download and parse through—or analyze—CSS files. However, if these files are too big (coupled with a poor internet connection), these requests can drastically increase the time it takes for a page to render.
Rather than serving every CSS file on the initial page load, we recommend extracting and serving only the CSS files required for “above the fold”—or part of the web page that’s visible before scrolling—rendering.

By serving only these files initially, then lazy loading the remaining CSS files, you boost your page load speed time.
5. Transform your site into a PWA for their incredible speed advantages
The biggest benefit of building a progressive web app (PWA) is speed. And many ecommerce storefronts are figuring this out. The way PWAs request information—in small, precise chunks rather than all at once—means the amount of data needed to load an ecommerce site with this technology is far less than traditionally-built sites.
Not only are PWAs fast because of this, they feel like using a mobile app but without the need to build one of those.
With an all-in-one Frontend Platform like Shogun Frontend, merchants get the benefits of headless commerce via progressive web apps but without needing to take the typical path to achieving this flexibility—think: DevOps, middleware, and multiple licenses. You can skip the infrastructure altogether!
For scaling ecommerce brands, opting for an all-in-one frontend platform means you enjoy the benefits of headless, but you can focus on high-impact activities that grow your revenue rather than wrangling and maintaining complex infrastructure.
Remember: Lighthouse scores are helpful, but they’re not a definitive measure
It’s tempting to want a single number or grade to gauge your site performance. But the truth is, performance tools can only tell you so much (and in a given time)
Overall, it’s best to think of Lighthouse scores as a continuous effort, not a one-and-done measurement.
#cta-visual-fe#<cta-title>Is your brand ready for an all-in-one Frontend Platform approach to ecommerce?<cta-title>Find out if Shogun Frontend is right for you. Take the quiz

Kaitlyn Ambrose
Kaitlyn works on all things content at Shogun. ⚡


