Measuring PWA Performance: What to Know About Data Integrity and ROI

So, you’re thinking about going headless with a progressive web app (PWA). That’s great!
You know the outcome you’re looking for: A fast-loading, easy-to-navigate, high-converting ecommerce site with more UX control.
It’s easy to focus on how fast your PWA will be—or the innovative shopping features you’ll unlock, but what about measuring the performance of a PWA?
If you go headless with a PWA, you’ll need to pay special attention to your ecommerce analytics setup—primarily around your data integrity and attribution.
Many brands often work with insufficient data without realizing it, which can make it impossible to know how effective a new PWA is among shoppers.
Today, we’ll cover the importance of having a clean analytics setup from the start, what to do if you realize you’re working with inaccurate data, and which metrics to pay special attention to when measuring your PWA performance.
Let’s get into it!
#cta-paragraph-fe#Learn about the benefits of PWAs and why they’re an excellent option for your headless store.
Skip ahead:
- The importance of proper analytics setup for PWAs
- The best tools for measuring your PWA
- The key metrics to pay attention to when measuring your PWA
First things first: PWAs are different from your standard ecommerce site, and the benefits are why retailers are paying attention.
One of the key differences is how attribution is tracked with a PWA. But before we get into this, it’s helpful to know how they work:
PWAs behave more like native apps than static websites and load lightning-fast. Loading first as a static web page, a PWA progressively becomes a single-page web app. Like Nomad.com, for example:
The beauty of PWA storefronts is how they speed up page-to-page load time (swapping out just the parts of the page that need to change for each subsequent page load).
This improved site speed keeps store visitors converting (slow-loading stores with even a one-second delay can experience an impact on conversions by up to 20%).
That said, tracking attribution and pageviews can get tricky.
Your attribution will be intact when users land on your site but is lost on subsequent pageviews because of how Google Tag Manager works with a PWA.
A PWA loads entirely only once, and Google Tag Manager sets attribution on landing and the first pageview.
But, because the site doesn’t refresh each time a new page is viewed, Google Tag Manager doesn’t account for any additional pageviews following that initial page landing—which jumbles your pageviews.
Even after you fix this pageview tracking issue, attribution is still unavailable due to changing URL structure. Your site loses the source of attribution as a visitor navigates to different pages due to a rogue referral—a bug that occurs when using Google Tag Manager with a PWA.
Here are a few telltale signs something is off with attribution post-PWA switch:
- Your sessions and direct traffic jump up, and conversion rate drops
- Your marketing channels start losing credit for conversions
- You see multiple sessions during a single visit per user while reviewing the User Explorer report in Google Analytics
Sounds like a headache, right? Luckily there’s a fix for this bug 🐛
How to fix the rogue referral bug with a PWA
Fortunately, the rogue referral bug can be fixed manually with developer help. Without getting too technical, this fix involves storing your initial page URL in a global variable, then manually setting the Document Location field in each of your Google Analytics tags to use that variable.
Once this fix is set up, you’ll monitor your data for the next 24 hours to ensure that sessions drop and your conversion rate increases.
#cta-paragraph-fe#Shogun Frontend offers merchants a solution for this bug as part of the implementation process. We make sure your tags are configured correctly from the start, so you’ll know your data is reliable.
It’s important to know that the rogue referral fix is a forward-looking solution—meaning that once this bug is no longer an issue, all data collected from that point on will be accurate (or should be), which is why it’s so important to have an implementation partner with PWA tracking experience!. It will not, however, fix previously-collected data.
#cta-visual-fe#<cta-title>Track your PWA performance correctly from the start<cta-title>With Shogun Frontend, our team of data experts works with yours to ensure proper tracking from launch day and beyond. Learn more
After you’ve taken stock of the data you’re using from an integrity standpoint, and assuming you have attribution set up correctly, here are some of the tools you’ll use to track the ROI and performance of your newly setup PWA:
Google Lighthouse
Google Lighthouse is an excellent tool for gauging the health of your site and areas that need optimizing.
Your Google Lighthouse Score combines the rating Google gives your site based on its performance, accessibility, SEO, and best practices.
While helpful as a gauge—Google Lighthouse scores shouldn’t be seen as an end-all, be-all tool or measure of success. Your score will constantly change due to factors like traffic routing changes, A/B tests, the device you check the score with, etc.
According to Google’s John Mueller, Lighthouse metrics indicate how fast a site performs for actual users and aren’t necessarily how Google’s algorithms assess a site’s speed.
In other words, if your customers think your site loads fast, it probably loads fast.
Mueller states:
“A lot of these metrics that you’re looking at from Lighthouse are primarily presented to you with regards to the user-facing side of things. From our point of view, from a search point of view, we take a variety of these metrics together to figure out how we should be seeing this site with regards to speed. The absolute measurements that you see there in Lighthouse are things that most likely have a stronger effect on how users see your site. So instead of asking Google, with regards to SEO, “is this site too slow?” I would look at it with users and get their feedback instead. If you’re saying that your site is actually pretty fast for users, and it provides the content fairly quickly, then probably you’re in a good state there.”
Check out Mueller’s conversation on a Google Webmaster Office Hours session:
What’s more, Google Lighthouse doesn’t account for any pageviews after the initial load. Instead, it’s better to think about your scores as a way to understand and identify areas of improvement.
The Chrome User Experience Report offers a more holistic look at the external factors that impact UX.
That said, it’s easy to run a Google Lighthouse audit, and you can run one whenever you want. No plugins or install required. We recommend running audits monthly so your team can see the results of optimizations or A/B tests.
How to run a Google Lighthouse audit
There are a few ways to run an audit.
You can copy and paste your website URL into this site: https://web.dev/measure/
Or, the second way involves a few additional steps:
- Open your website in an incognito Google Chrome browser tab.
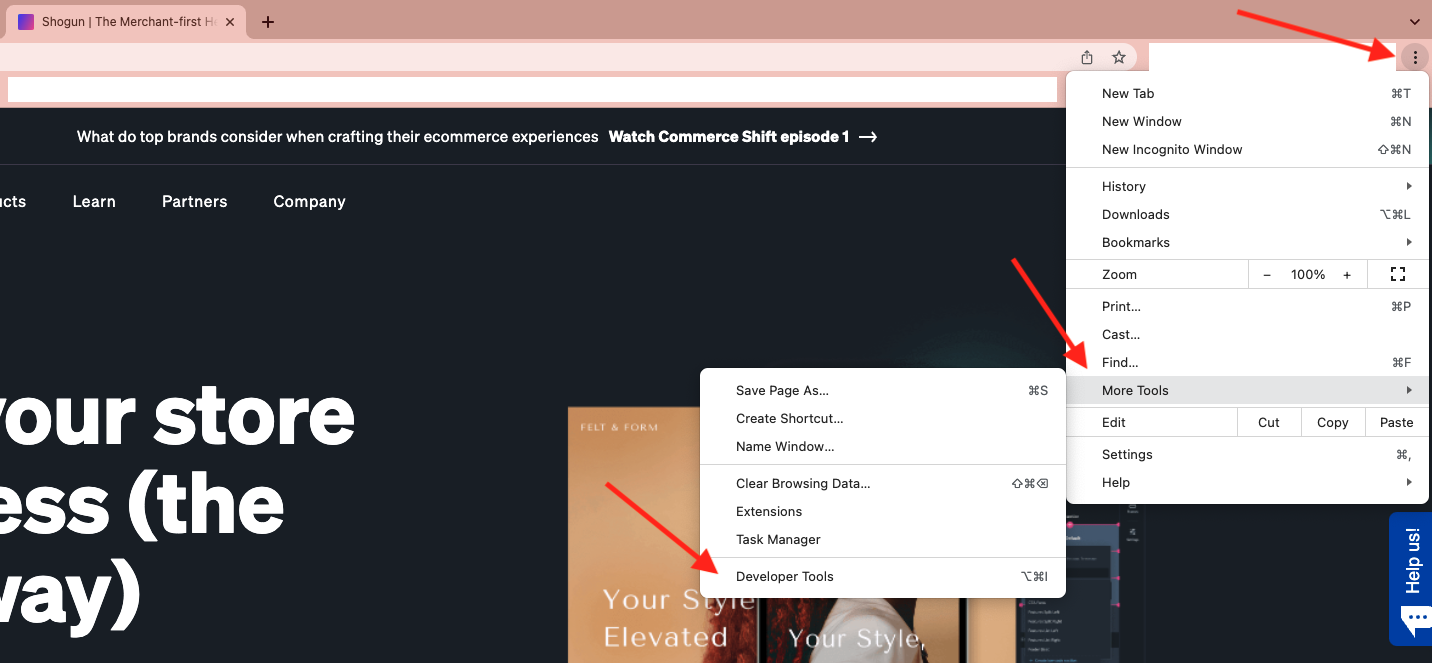
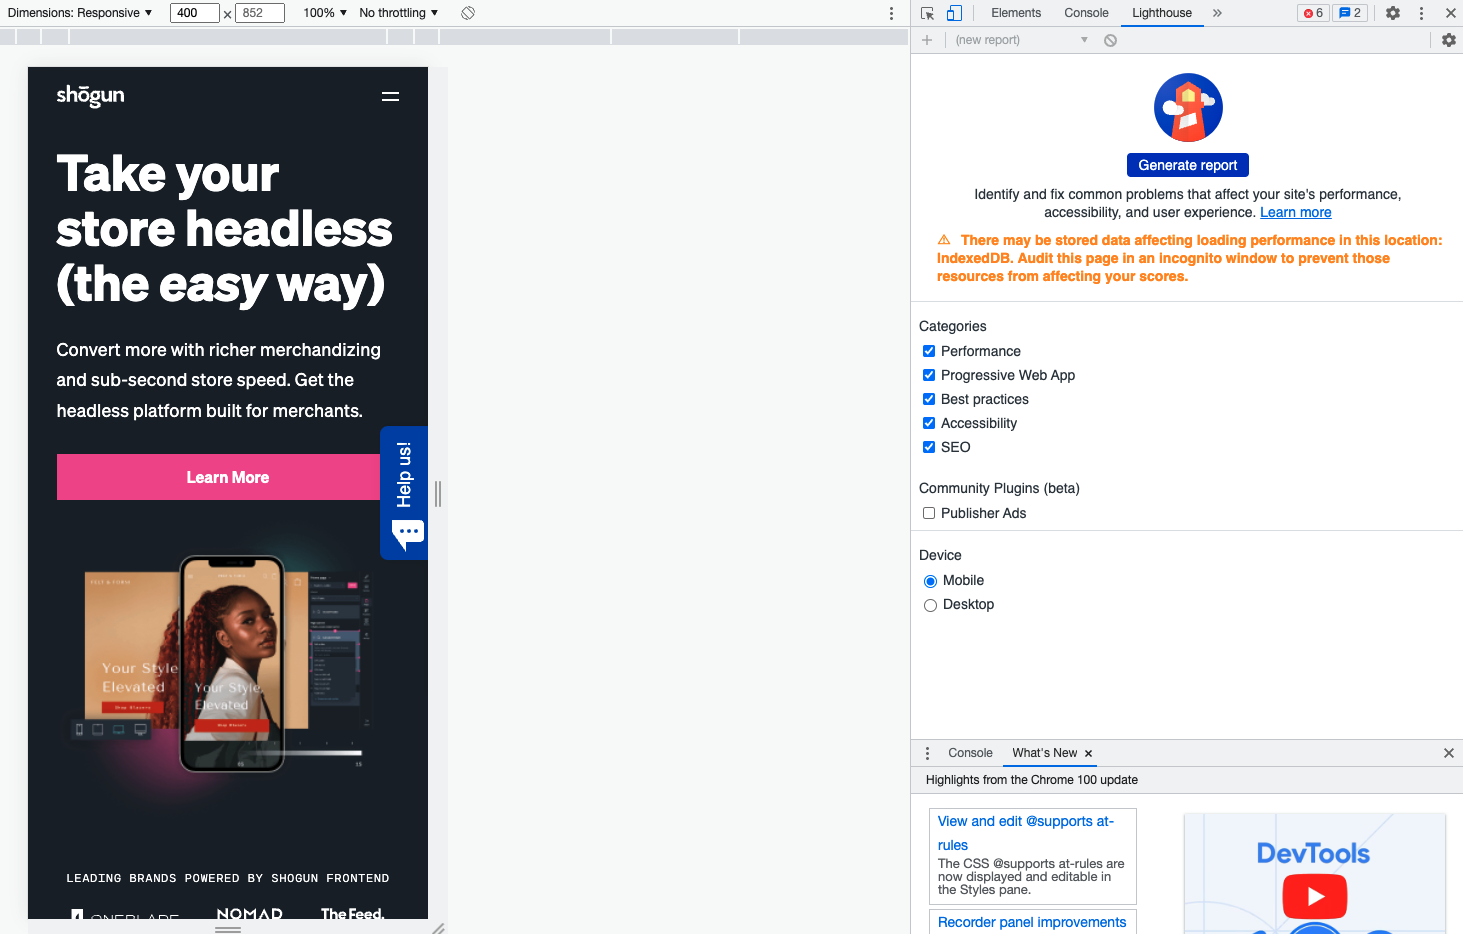
- In the upper right-hand side of your browser, click the three dots, and navigate to More Tools > Developer Tools.

- Click “Generate Report” and watch Google Lighthouse do its thing!

Google Analytics
While the way you use Google Analytics won’t be different with a PWA (no new reports or dashboards to learn), there are a few things to keep in mind as you track the performance or ROI of your new site.
Keeping a close eye on Google Analytics metrics like pageviews and events can help you determine if your analytics are set up correctly.
- For example,your total pageviews per session should increase (in theory) because shoppers can view more pages in a single session due to how fast your new site runs. However, there could be a tracking issue if you see a drop here.
- A dip in events like add to cart or email signups could also indicate an issue with your tracking configuration.
#cta-paragraph-fe#For more on what you can be looking at in GA as you optimize store performance, check out this post on the various reports you can view with tips on what to look out for.
Google Tag Manager
When migrating to a PWA, you start with a clean slate. In other words, all of your third-party marketing tags and tracking codes will need to be manually set up—no automatic 1:1 translation here. This includes tags from platforms like Facebook, TikTok, CJ, and other marketing pixels.
The key difference here is that you need to ensure your marketing tags are firing on virtual pageviews. If you see a drop in your event activity, this could indicate an issue with your tagging setup.
But once your tags are set up correctly, you’ll use Google Tag Manager just like you would with a traditional ecommerce site.
#cta-paragraph-fe#Ensuring proper Google Tag Manager setup is part of the Shogun Frontend build experience. We’ll make sure your third-party tags and tracking codes are correctly added and firing correctly.
Shopify Analytics
A great benefit of migrating to a PWA is that you have the option to keep your Shopify backend.
However, the key reports and marketing tools you’ve become accustomed to in Shopify Analytics won’t be as effective with a PWA.
The reason is simple: A user won’t hit your Shopify backend until checkout.
Here’s why: A customer can come to your PWA storefront, browse, and add things to their cart—but if they leave before checking out, Shopify Analytics won’t pick up that activity.
That’s why stitching your data together in platforms like Google Analytics is critical. Any integrations you have set up pre-checkout will need to be added directly to your PWA to be counted.
Still, Shopify Analytics will show the conversion rate of users who purchase—which can help with lower-funnel analysis—but until your pre-checkout integrations are added to your PWA, it’ll be difficult to get an accurate representation of the activity on your site.
Once you know you’re set up to measure your PWA correctly, it’s time to get tracking!
Here are a few important metrics to track as you watch your new PWA.
Site speed KPIs
Prioritizing site speed ensures the best possible customer experience. Plus, speed impacts how your site ranks on Google.
While it isn’t the only benefit of a PWA, page-to-page load time is an excellent indicator of how your new site performs. You’ll likely notice significant changes to these metrics found in Google Lighthouse after your new PWA goes live:
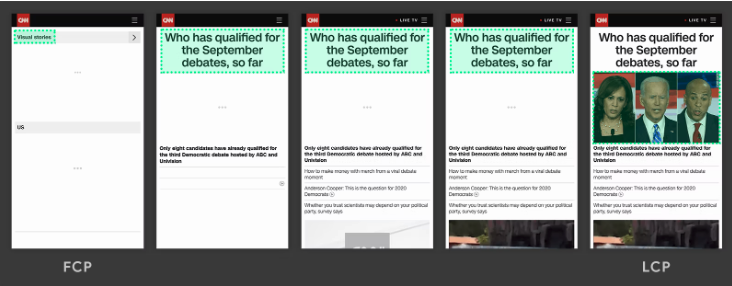
First Contentful Paint
First Contentful Paint indicates the time at which the very first image or text is “painted” or populated when a shopper navigates to your site.
Google recommends clocking a first contentful paint score between 0-1.8 seconds for your site to be considered “fast.”
Largest Contentful Paint
Largest Contentful Paint marks when the page’s primary (or most significant) content loads relative to when the page first began to load.
For this, Google recommends aiming for a score of 2.5 seconds or less.
If your PWA scores well against both First Contentful Paint and Largest Contentful Paint, you’ll notice how fast your site loads as soon as you access it.

Time to Interactive
Time to Interactive (TTI) is another speed metric in the Google Lighthouse audit. TTI refers to how long it takes a page to become completely interactive.
According to Google, a page is fully interactive when it checks these boxes:
- The page displays useful content (measured by First Contentful Paint)
- Event handlers are registered for most visible page elements, and
- The page responds to user interactions within 50 milliseconds
Tracking TTI is important because not all sites optimize content visibility and interactivity. Sometimes one comes at the cost of the other.
In other words, your site looks like it’s ready to use, but when a customer tries to engage, it isn’t responsive.
A non-responsive (or slow to respond) site can send customers running faster than you can say “Time to Interactive.”
Google recommends aiming for a TTI score between 0-3.8 seconds. Your Google Lighthouse audit will help you know what to do if your site is clocking a high TTI.
Total Blocking Time
Last but not least of the speed metrics, your site’s Total Blocking Time (TBT) brings it all together.
TBT reveals the sum of all time between your First Contentful Paint and Time to Interactive; it measures the total time a page is prevented from responding to customer engagement like clicks, screen taps, or keyboard presses.
Any interaction that takes longer than 50 milliseconds is considered long or slow, and any time after that initial 50 milliseconds is regarded as the “blocking” time.
For example, if it takes 75 milliseconds for a page to begin loading after a shopper clicks a button on your site, your blocking time would be 25 milliseconds.
These tiny blocks of time contribute to your overall site speed, which can impact your conversion rate.
Revenue-based KPIs
In addition to KPIs like ecommerce conversion rate, there are other revenue-indicating metrics to measure the success of your PWA (and can help you salvage broken data):
Average order value (AOV)
Since customers can shop your site faster due to your PWA’s speed, brands often see an increase in AOV because shoppers can view more pages in a single session.
AOV is a great way to gauge how your site performs post-PWA migration compared to your old site concerning speed.
Transactions per user (TPU)
TPU offers insight into how much value each customer brings. This is a great metric to watch if you’ve experienced data tracking issues after migrating to a PWA.
With TPU, you can know the number of transactions your store makes in relation to how many customers have visited your site now that it’s speedy and dynamic.
Measuring the success of your PWA
So much planning and preparation go into building a PWA—from the branding and look and feel to the functionality and user experience.
It’s important to keep how you measure your PWA top of mind during this process. That way, you can accurately track the ROI of your site from launch day onward.
Brands like The Feed and OneBlade have seen significant results with their new Shogun Frontend-powered PWAs—like a 10.3% increase in revenue per visitor for The Feed and a 579% increase in active refill subscriptions for OneBlade.
It would be difficult to know those metrics without a proper analytics setup for each site.
Going headless with a PWA is a big step, and you want the right team in your corner. With Shogun Frontend, our team works with you at every step to make sure your site experience lives up to your expectations and that you’re working with accurate data from launch day and beyond.
#cta-visual-fe#<cta-title>Track your PWA performance correctly from the start<cta-title>With Shogun Frontend, our team of data experts works with yours to ensure proper tracking from launch day and beyond. Learn more

Kaitlyn Ambrose
Kaitlyn works on all things content at Shogun. ⚡


